ArcGIS API for JavaScript
Go to Latest version (official documentation)
ArcGIS Web API JavaScript API 4.4 Sample Code

ArcGIS API for JavaScript

Home Guide API Reference Sample Code Forum

Get Started

Overview

Latest Samples

WMTSLayer
Select WMTS sublayer
WMSLayer
Generate data-driven visualization of unique values
Generate continuous color visualization for 3D buildings
Reference Arcade expressions in PopupTemplate
PopupTemplate with promise
Highlight point features
Highlight SceneLayer
Point styles for cities
Using callout lines with labels
Coloring options for textured buildings
Intensity color modulation
Zoom to extent of features
Disable panning on the view
Disable rotation on the view
Disable scroll-zooming on the view
Disable all zooming on the view
Custom Tile Layer
Custom Dynamic Layer
Custom Lerc Layer
Custom Blend Layer
Custom ElevationLayer - Exaggerating elevation
Custom ElevationLayer - Thematic data as elevation
Swap view from 2D to 3D
Draw polygon for spatial query
Measure while drawing
Print widget vector tiles

Mapping and Views

Get started with MapView (2D)
Get started with SceneView (3D)
Load a basic web map
Load a basic web scene
Save a web scene
Web scene - slides
Create a local scene
SceneView - goTo()
View padding
Create a custom basemap
Swap web maps in the same view
Swap view from 2D to 3D

Layers

Get started with layers
Create layer from portal item
VectorTileLayer
IntegratedMeshLayer
StreamLayer
CSVLayer
OpenStreetMapLayer
WebTileLayer
WMSLayer
WMTSLayer
Select WMTS sublayer
GeoRSSLayer

FeatureLayer

Get started with FeatureLayer
Drawing improvements
Created from array of graphics
FeatureLayerView - query
Highlight point features

SceneLayer

Get started with SceneLayer
Realistic buildings
Coloring options for textured buildings
Point geometries
Filter and query
SceneLayerView - query
Highlight SceneLayer

MapImageLayer

Get started with MapImageLayer
Toggle sublayer visibility
Set definition expressions on sublayers
Set renderers on sublayers
Label sublayer features
Create dynamic map layers
Dynamic data layer with table join
Dynamic data layer with query table
Dynamic data layer with raster data

ImageryLayer

Get started with ImageryLayer
Client side pixel filter
Server side raster function
Client side rendering rules
Raster attribute table

PointCloudLayer

Get started with PointCloudLayer
Toggle visualizations
Change point size and density
Intensity color modulation

Custom Layers

Custom Tile Layer
Custom Dynamic Layer
Custom Lerc Layer
Custom Blend Layer
Custom ElevationLayer - Exaggerating elevation
Custom ElevationLayer - Thematic data as elevation

Visualization

Symbol Playground
Visualize features by unique types
Visualize data with class breaks
Generate data-driven continuous color visualization
Generate data-driven visualization of unique values
Generate continuous color visualization for 3D buildings
Data-driven continuous color
Data-driven continuous size
Data-driven extrusion
Multivariate visualizations (3D)
Create a custom visualization using Arcade
Visualize features with realistic WebStyleSymbols
Point styles for cities
Using callout lines with labels

Popups

Get started with popups
Get started with PopupTemplate
Dock popup positions
Multiple popup elements
Reference Arcade expressions in PopupTemplate
PopupTemplate with functions
PopupTemplate with promise
Popup actions
Custom popup actions per feature

Editing

FeatureLayer applyEdits

Graphics

Get started with graphics
Add graphics to a SceneView

Searching

Search widget
Search widget with multiple sources
Query features from a FeatureLayer
SceneLayer - query a linked FeatureLayer
QueryTask
FindTask
IdentifyTask

Analysis

GeometryEngine - geodesic buffers
Geoprocessing - viewshed analysis
Geoprocessing - hotspot analysis
RouteTask
Query Elevation (points)
Query Elevation (lines)

Widgets

Get started with widgets
BasemapGallery widget
LayerList widget
LayerList widget with actions
Legend widget
Locate button
Print widget
Print widget vector tiles
Track current location
Track widget simulation
Expand widget
Using the view's UI
Responsive widgets

Widgets (Advanced)

Create a custom widget
Custom Recenter widget
Using widgets with Angular
Using widgets with React
Using widgets with Riot
Custom widgets with Vue

More 3D

Toggle ground elevation
Look around camera position
Realistic environment settings
SceneView - environment settings
Elevation offset
ElevationLayer
Satellites in 3D view

Workflows

Get started with Workflow Manager

Other

Draw polygon for spatial query
Measure while drawing
Request data from a remote server
Access ArcGIS Online items via OAuth
Chaining promises
Access features with click events
Synchronize MapView and SceneView
Calcite Maps and Bootstrap
Using Esri Icon Fonts
Watch for changes
Zoom to extent of features
Drag and drop portal items
Disable panning on the view
Disable rotation on the view
Disable scroll-zooming on the view
Disable all zooming on the view
Back to Top
Back to Top

Custom ElevationLayer - Thematic data as elevation

This device does not support 3D.

View the system requirements for more information.

Explore in the sandboxJS BinView live

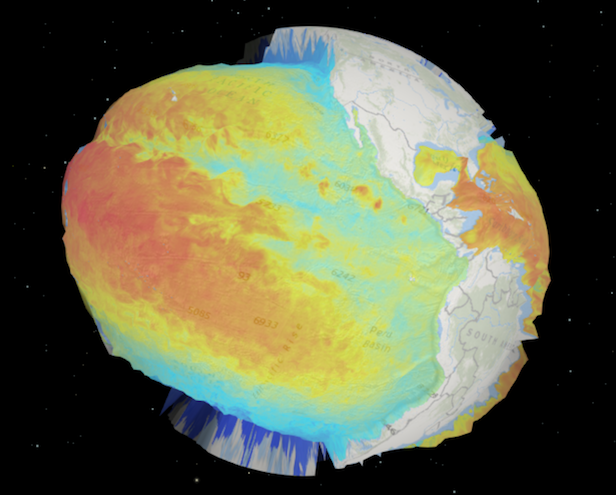
This sample demonstrates how to create a custom ElevationLayer using thematic data. In this case the thematic variable is sea temperature. The warmer the temperature, the higher the elevation. The elevation of land areas represents the average sea surface temperature (~17° C), so the pseudo ocean elevations that peak above nearby land are areas where the temperature is greater than 17° C and vice versa. A white graphic is overlaid at this elevation to show temperatures greater than 17°. This graphic may be moved by sliding the handle of the Temperatures above ##° slider.

Switch the viewingMode of the SceneView to global to get a different view of the data.

custom-temp-layer-globe

Creating a custom elevation layer

To create a custom ElevationLayer, you must call createSubclass() on BaseElevationLayer.

Since this sample exaggerates thematic values from an ImageryLayer, we require ImageryLayer and load the ScientificData/SeaTemperature image service as a dependency of the custom layer. This is done inside the load() method because it is a loadable resource.

Since the temperatures have a relatively small range (-2°C to 30°C), we'll need to multiply them by a large number so we can see enough contrast between elevations at small scales. We'll create a factor property to specify this value.

var Temperature3DLayer = BaseElevationLayer.createSubclass({

    properties: {
      // exaggerates the temps by 80000x so we can see
      // variation at large scales
      exaggeration: 80000
    },

    load: function() {
        // load ImageryLayer containing temperature values
        // See the code in the sandbox for details about
        // createTemperatureLayer()
        this._temperature = createTemperatureLayer(depth, tempDate, "lerc");
        this.addResolvingPromise(this._temperature.load());
      },
  });

The createTemperatureLayer() function returns an ImageryLayer visualizing temperature values for for a specific date and sea depth. We request the data in lerc format so the value of each pixel represents a temperature value.

Then we must manipulate the fetchTile() method so that it returns new elevation values based solely on sea temperature. Therefore, we expect to see variation in z values for pixels covering the oceans, but a constant value for land.

To position the elevation values properly, we can fetch images from the ImageryLayer using the extent properties returned from the getTileBounds() method. Once the image covering the area of the elevation tile is fetched, we can manipulate the values of each pixel so it can more closely resemble an elevation. The function iterates through each pixel and multiplies its value by the factor. If we encounter pixels covering land (noDataValues), then we'll set a constant elevation of the average sea temperature multiplied by the factor. fetchTile() must return a promise that resolves to an object specified in ElevationTileData.

fetchTile: function(level, row, col) {
  var bounds = this.getTileBounds(level, row, col);
  // Add one because of overlapping vertices in neighboring tiles
  var tileSize = this.tileInfo.size[0] + 1;
  var extent = new Extent({
    xmin: bounds[0],
    ymin: bounds[1],
    xmax: bounds[2],
    ymax: bounds[3],
    spatialReference: this.spatialReference
  });
  var factor = this.factor;

  // fetch the image representing temperature for the extent of the tile.
  // this method returns the pixel data of the image for the extent
  // of the given elevation tile
  return this._temperature.fetchImage(extent, tileSize, tileSize)
    .then(function(data) {

      var pixelBlock = data.pixelData.pixelBlock;
      // contains the temperature values of each pixel in the image
      var elevations = pixelBlock.pixels[0];
      var stats = pixelBlock.statistics[0];
      // pixels that don't contain any temperature values
      var noDataValue = stats.noDataValue;

      elevations.forEach(function(value, index, pixelData) {
        if (value !== noDataValue) {
          // multiply temperatures by the given factor
          pixelData[index] = value * factor;
        }
        else {
          // areas with no temperature data (land)
          // will be assigned the average sea surface
          // temperature (17 degrees Celsius)
          pixelData[index] = 17*factor;
        }
      });

      // return the modified temperatures as elevations
      return {
        values: elevations,
        width: pixelBlock.width,
        height: pixelBlock.height,
        noDataValue: noDataValue
      };
    }.bind(this));
}

Once the Temperature3DLayer layer is created, you must add it to the layers of the Map.ground property and add the map to a SceneView instance. We also add a custom 2D tile layer draped on top of the surface to make the elevation data easier to see.

// Add the Temperature3DLayer as an elevation layer to the map
// with a 2D ImageryLayer representing elevation draped on top
var map = new Map({
  basemap: "oceans",
  ground: {
    layers: [
      new Temperature3DLayer()
    ]
  },
  layers: [ new Temperature2DLayer() ]
});
Tags

3D,BaseElevationLayer,SceneView,4.4,ElevationLayer,custom,createSubclass,fetchTile,loadable,thematic elevation

3 results for Sample Code:"elevationlayer"

TagsElevationLayer
scene-elevationlayer

ElevationLayer

layers-custom-elevation-exaggerated

Custom ElevationLayer - Exaggerating elevation

layers-custom-elevation-thematic

Custom ElevationLayer - Thematic data as elevation

TitleSample
ElevationLayerExplore in the sandboxSandboxJS BinView live
Custom ElevationLayer - Exaggerating elevationExplore in the sandboxSandboxJS BinView live
Custom ElevationLayer - Thematic data as elevationExplore in the sandboxSandboxJS BinView live

There were no match results from your search criteria.

Feedback on this topic?
ArcGIS for Developers
  • Home
  • Features
  • Documentation
  • Support
  • Pricing
  • Startups
  • Blog
ArcGIS Platform
  • ArcGIS Online
  • ArcGIS Desktop
  • ArcGIS Enterprise
  • ArcGIS for Developers
  • ArcGIS Solutions
  • ArcGIS Marketplace
About Esri
  • About Us
  • Careers
  • Insiders Blog
  • User Conference
  • Developer Summit

Copyright © 2017 Esri. All rights reserved. | Privacy | Terms of use | Plain English | FAQ