SimpleRenderer renders all features in a Layer with one Symbol. This renderer may be used to simply visualize the location of geographic features. For example, layers representing political boundaries, cities, buildings, rivers, etc. that are typically used for providing geographic context in an application may be defined with a single symbol per layer.
Supported layers
SimpleRenderer may only be used to create visualizations for the following layer types:
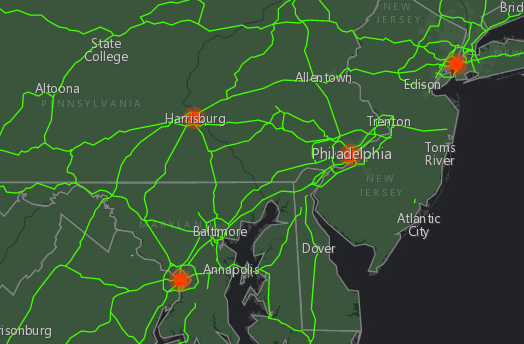
The example in the screenshot below contains three layers: one of state boundaries, another of highways, and another of cities. Each gives geographic context to the map.
SimpleRenderer can also be used to thematically visualize numeric data attributes. This is accomplished with visual variables. Visual variables define the parameters for data-driven visualizations of numeric data. They allow you to easily map continuous ramps of color, size, and/or opacity to minimum and maximum data values of one of the layer's numeric attribute fields.
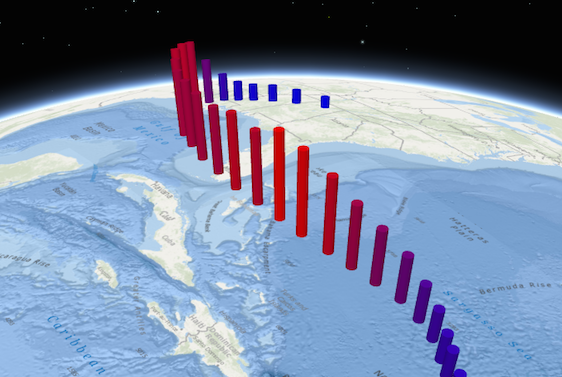
The example below adds size and color visual variables in a 3D SceneView to thematically visualize a hurricane's windspeed in various locations along its path.
To read more about visual variables, see the visualVariables property.
// Set a basic symbol on a layer to visualize all features the same way
var citiesRenderer = new SimpleRenderer({
  symbol: new SimpleMarkerSymbol({
    size: 6,
    color: "black",
    outline: {
      width: 0.5,
      color: "white"
    }
  })
});
var citiesLayer = new FeatureLayer({
  url: "http://url.to.service",
  renderer: citiesRenderer
});
// Set a continuous color ramp on the renderer with visual variables
var citiesRenderer = new SimpleRenderer({
symbol: new SimpleFillSymbol(),
visualVariables: [{
type: "color",
field: "POPULATION",
normalizationField: "SQ_KM",
// features with 30 ppl/sq km or below are assiged the first color
stops: [{ value: 100, color: "#FFFCD4" },
{ value: 500, color: "#0D2644" }]
}]
});
var citiesLayer = new FeatureLayer({
url: "http://url.to.service",
renderer: citiesRenderer
});Constructors
new SimpleRenderer(properties)
properties Object See the properties for a list of all the properties that may be passed into the constructor. |
Property Overview
| Name | Type | Summary | |
|---|---|---|---|
| String | The name of the class. more details | more details | |
| String | The label for the renderer. more details | more details | |
| Symbol | The symbol used by the renderer to visualize all features in the layer. more details | more details | |
| String | The type of renderer. more details | more details | |
| Object[] | Visual variables define the parameters for data-driven geographic visualizations of numeric data. more details | more details | |
Property Details
declaredClassStringreadonly
The name of the class. The declared class name is formatted as
esri.folder.className.labelString
The label for the renderer. This describes what features with the given symbol represent in the real world. This will display next to the layer's symbol inside the Legend widget.
This text is not displayed in the Legend when visualVariables are used. When the renderer contains visualVariables, you should set the
titleproperty inlegendOptionson each visual variable to describe the visualization.symbolSymbol
The symbol used by the renderer to visualize all features in the layer.
typeStringreadonly
The type of renderer. For SimpleRenderer this value is always
simple.visualVariablesObject[]
Visual variables define the parameters for data-driven geographic visualizations of numeric data. They allow you to easily map continuous ramps of color, size, opacity, and/or rotation to minimum and maximum data values of one of the layer's numeric attribute fields.
Visual variables can primarily be used in two ways.
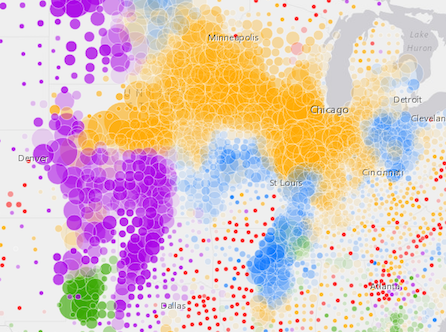
1. Thematic mapping
Visual variables allow you to easily create stunning visualizations based on thematic attributes (e.g. population, education, rank, money, magnitude, etc.) in either 2D or 3D. This is accomplished by mapping data values from a numeric field attribute to color, size, and/or opacity values. The renderer then takes over and re-sizes or shades features based on the value of the given field and its position relative to the minimum and maximum values. The sample below uses three visual variables (size, color, and opacity).
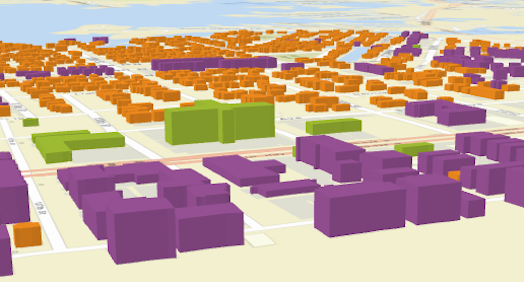
2. Mapping real-world sizes
The size visual variable can be used to visualize the true sizes of features (e.g. tree canopy, road width, building height, etc.) based on their size in the real world. This can be particularly powerful when working in a 3D SceneView. The image below shows a layer of building footprints that uses visual variables to extrude each feature to the true height of the buildings based on data stored in an attribute field.
The
visualVariablesproperty of the renderer is an array of objects called "visual variables". Each object must indicate the type of visual variable to apply (e.g. color, size, opacity, rotation), the numeric field from which to drive the visualization, and the ramp of visual values to map to the data. The following list identifies each visual variable type and provides a link to the specification table of each.Type Object Specification Legend Example color ColorVisualVariable 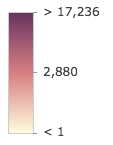
size SizeVisualVariable 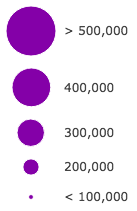
opacity OpacityVisualVariable 
rotation RotationVisualVariable - See the Visualize features with realistic 3D symbols for an example of using multiple visual variables to visualize your data.
Method Overview
| Name | Return Type | Summary | |
|---|---|---|---|
| SimpleRenderer | Creates a deep clone of the renderer. more details | more details | |
| * | Creates a new instance of this class and initializes it with values from a JSON object generated from a product in the ArcGIS platform. more details | more details | |
| Object | Converts an instance of this class to its ArcGIS Portal JSON representation. more details | more details | |
Method Details
clone(){SimpleRenderer}
Creates a deep clone of the renderer.
Returns:Type Description SimpleRenderer A deep clone of the object that invoked this method. Example:// Creates a deep clone of the first layer's renderer var renderer = view.map.layers.getItemAt(0).renderer.clone();fromJSON(json){*}static
Creates a new instance of this class and initializes it with values from a JSON object generated from a product in the ArcGIS platform. The object passed into the input
jsonparameter often comes from a response to a query operation in the REST API or a toJSON() method from another ArcGIS product. See the Using fromJSON() topic in the Guide for details and examples of when and how to use this function.Parameter:json ObjectA JSON representation of the instance in the ArcGIS format. See the ArcGIS REST API documentation for examples of the structure of various input JSON objects.
Returns:Type Description * Returns a new instance of this class. Converts an instance of this class to its ArcGIS Portal JSON representation. See the Using fromJSON() topic in the Guide for more information.
Returns:Type Description Object The ArcGIS Portal JSON representation of an instance of this class.