Method Overview
| Name | Return Type | Summary | |
|---|---|---|---|
| Promise | Generates a Renderer that may be applied directly to the layer used to call this method. more details | more details | |
| Promise | This method generates a color visual variable with default stops that are optimally chosen based on the statistics queried for the indicated field or expression and colors based on the input basemap. more details | more details | |
Method Details
createContinuousRenderer(params){Promise}
Generates a Renderer that may be applied directly to the layer used to call this method. The renderer contains a continuous color visual variable that maps optimal colors based on the indicated basemap to specific stop values based on queried statistics from the indicated field or expression.
In most cases you will provide a
layer,basemap,field, andthemeto generate this renderer. This is a scenario in which the statistics of the data aren't well known and the user doesn't know what colors to use in the visualization.The other options are provided for convenience for more involved custom visualization authoring applications. For example, if you already generated statistics in another operation, you can pass the statistics object to the
statisticsparameter to avoid making an extra call to the server.Parameters:params ObjectInput parameters for generating a continuous color visualization based on data returned from a given field or expression. See the table below for details of each parameter.
Specification:layer FeatureLayer | SceneLayerThe layer for which the visualization is generated.
field StringThe name of the field whose data will be queried for statistics and used for the basis of the data-driven visualization.
optionalnormalizationField StringThe name of the field to normalize the values of the given
field. Providing a normalization field helps minimize some visualization errors and standardizes the data so all features are visualized with minimal bias due to area differences or count variation. This option is commonly used when visualizing densities.optional The named string of the Esri basemap or basemap object that will be paired with the output visualization.
Default Value: grayoptionaltheme StringDetermines which values will be emphasized in the continuous ramp and the map. Valid values are listed below.
Value Description Example high-to-low High values are emphasized with strong colors. 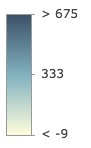
above-and-below Values centered around a given point (e.g. the average) are visualized with weak colors while other values are emphasized with strong colors. 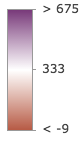
centered-on Values centered around a given point (e.g. the average) are emphasized with strong colors while other values are visualized with weak colors. 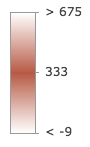
extremes High and low values are emphasized with strong colors. All others are visualized with weak colors. 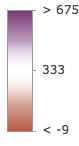 optionalcolorScheme ColorScheme
In authoring apps, the user may select a pre-defined color scheme. Pass the scheme object to this property to avoid getting one based on a
themeand thebasemap.optionallegendOptions ObjectProvides options for setting a title to a field when an expression is provided instead of a field name. This title will represent the field in the Legend.
Specification:title StringThe title used to represent the given field or expression in the Legend.
optionalstatistics SummaryStatisticsResultA statistics object generated from the summaryStatistics function. If statistics for the field have already been generated, then pass the object here to avoid making a second statistics query to the server.
optionalminValue NumberA custom minimum value set by the user. Use this in conjunction with
maxValueto generate statistics between lower and upper bounds. This will be the lowest stop in the returned color visual variable.optionalmaxValue NumberA custom maximum value set by the user. Use this in conjunction with
minValueto generate statistics between lower and upper bounds. This will be the uppermost stop in the returned color visual variable.optionaldefaultSymbolEnabled BooleanEnables the
defaultSymbolon the renderer and assigns it to features with no value and features that do not fall within the configured data range.optionalview SceneViewThe SceneView instance in which the visualization will be rendered. This parameter is required if
symbolType = "3d-volumetric", but isn't required for layers with ameshgeometry type.optionalsymbolType StringThe type of symbol to generate. This depends on the view in which you are working and the desired visualization. This parameter does not need to be specified for layers with a
meshgeometry type. Known values are described below.
Default Value: 2dValue Description 2d Generates a visualization using 2D symbols such as SimpleMarkerSymbol, SimpleLineSymbol, or SimpleFillSymbol. Use this option if generating a visualization for data in a MapView. 3d-flat Generates a visualization using 3D symbols with flat symbol layers such as IconSymbol3DLayer, LineSymbol3DLayer, or FillSymbol3DLayer. Use this option if generating a 2D visualization for data in a SceneView. 3d-volumetric Generates a visualization using 3D symbols with volumetric symbol layers such as ObjectSymbol3DLayer, PathSymbol3DLayer, or ExtrudeSymbol3DLayer. Use this option if generating a 3D visualization for data in a SceneView. A SceneView instance must be provided to the viewparameter if this option is used.optionalcolorMixMode StringThis option only applies to generating renderers for mesh SceneLayers. Specifies how the symbol's color is applied to the geometry color/texture. See the documentation in FillSymbol3DLayer.material for more context. See the table below for possible values.
Value Description tint Applies the symbol colorto the desaturated geometry/texture color.replace Removes the geometry/texture color and applies the symbol color.multiply Multiplies geometry/texture color value with the symbol colorvalue. The result is a darker color. Multiplying with white keeps the geometry color the same.Default value: replace
Returns:Type Description Promise Resolves to an instance of ContinuousRendererResult. Example:var layer = new FeatureLayer({ url: "https://services.arcgis.com/V6ZHFr6zdgNZuVG0/arcgis/rest/services/counties_politics_poverty/FeatureServer/0" }); // visualization based on field and normalization field var colorParams = { layer: layer, basemap: map.basemap, // "gray" field: "POP_POVERTY", normalizationField: "TOTPOP_CY", theme: "above-and-below" }; // when the promise resolves, apply the renderer to the layer colorRendererCreator.createContinuousRenderer(colorParams) .then(function(response){ layer.renderer = response.renderer; });createVisualVariable(params){Promise}
This method generates a color visual variable with default stops that are optimally chosen based on the statistics queried for the indicated field or expression and colors based on the input basemap.
There are two different ways this method may be called. The most common case is by providing a
layer,basemap,field, andtheme. This is the scenario where the statistics of the data aren't well known and the user doesn't know what colors to use.The other options are provided for convenience for more involved custom visualization authoring applications. For example, if you already generated statistics in another operation, you can pass the object in the
statisticsparameter to avoid making an extra call to the server. You can also provide acolorSchemeif you don't want one picked for you. In this case thebasemapandthemeoptions would be ignored.Parameters:params ObjectInput parameters for generating a color visual variable based on data returned from a given field or expression. See the table below for details of each parameter.
Specification:layer FeatureLayer | SceneLayerThe layer for which the visual variable is generated.
field StringThe name of the field whose data will be queried for statistics and used for the basis of the data-driven visualization.
optionalnormalizationField StringThe name of the field to normalize the values of the given
field. Providing a normalization field helps minimize some visualization errors and standardizes the data so all features are visualized with minimal bias due to area differences or count variation. This option is commonly used when visualizing densities.optional The named string of the Esri basemap or basemap object that will be paired with the output visualization.
Default Value: grayoptionaltheme StringDetermines which values will be emphasized in the continuous ramp and the map. Valid values are listed below.
Value Description Example high-to-low High values are emphasized with strong colors. above-and-below Values centered around a given point (e.g. the average) are visualized with weak colors while other values are emphasized with strong colors. centered-on Values centered around a given point (e.g. the average) are emphasized with strong colors while other values are visualized with weak colors. extremes High and low values are emphasized with strong colors. All others are visualized with weak colors. optionalcolorScheme ColorSchemeIn authoring apps, the user may select a pre-defined color scheme. Pass the scheme object to this property to avoid getting one based on a
themeand thebasemap.optionallegendOptions ObjectProvides options for setting a title to a field when an expression is provided instead of a field name. This title will represent the field in the Legend.
Specification:title StringThe title used to represent the given field or expression in the Legend.
optionalstatistics SummaryStatisticsResultA statistics object generated from the summaryStatistics function. If statistics for the field have already been generated, then pass the object here to avoid making a second statistics query to the server.
optionalminValue NumberA custom minimum value set by the user. Use this in conjunction with
maxValueto generate statistics between lower and upper bounds. This will be the lowest stop in the returned color visual variable.optionalmaxValue NumberA custom maximum value set by the user. Use this in conjunction with
minValueto generate statistics between lower and upper bounds. This will be the uppermost stop in the returned color visual variable.optionalview SceneViewThe SceneView instance in which the visualization will be rendered. This property is only applicable to generating visualizations with 3D symbols, except for layers with a
meshgeometry type.optionalworldScale BooleanIndicates if the size units of the symbols will be in meters. This should be
truewhen generating visualizations with 3D volumetric symbology, except for layers with ameshgeometry type. Aviewmust be provided if this property is set totrue.Returns:Type Description Promise Resolves to an instance of VisualVariableResult. Example:var layer = new FeatureLayer({ url: "https://services.arcgis.com/V6ZHFr6zdgNZuVG0/arcgis/rest/services/counties_politics_poverty/FeatureServer/0" }); // visualization based on field and normalization field var colorParams = { layer: layer, basemap: map.basemap, // "gray" field: "POP_POVERTY", normalizationField: "TOTPOP_CY", theme: "above-and-below" }; // when the promise resolves, apply the visual variable to the renderer colorRendererCreator.createVisualVariable(colorParams) .then(function(response){ var renderer = layer.renderer.clone(); renderer.visualVariables = [ response.visualVariable ]; layer.renderer = renderer; });
Type Definitions
ContinuousRendererResult
The result object of the createContinuousRenderer() method. See the table below for details of each property.
Properties:renderer ClassBreaksRendererThe renderer object configured to best match the given basemap and the spread of the data. Set this on a layer's
rendererproperty to update its visualization.visualVariable ColorVisualVariableA color visual variable configured based on the statistics of the data and the given basemap and scheme.
colorScheme ColorSchemeThe color scheme used by the visual variable.
defaultValuesUsed BooleanIndicates whether default values are used in the absence of sufficient data and/or statistics from the layer. Default values are typically used when all features have the same field value or no value at all.
statistics SummaryStatisticsResultBasic statistics returned from a query to the service for data from the given field name or expression.
basemapId StringThe ID of the basemap used to determine the optimal fill color of the features.
VisualVariableResult
The result object of the createVisualVariable() method. See the table below for details of each property.
Properties:visualVariable ColorVisualVariableA color visual variable configured based on the statistics of the data and the given basemap and scheme.
colorScheme ColorSchemeThe color scheme used by the visual variable.
statistics SummaryStatisticsResultBasic statistics returned from a query to the service for the given field or expression.
defaultValuesUsed BooleanIndicates whether default values are used in the absence of sufficient data and/or statistics from the layer. Default values are typically used when all features have the same field value or no value at all.
basemapId StringThe ID of the basemap used to determine the optimal fill color of the features.
authoringInfo AuthoringInfoAuthoring information related to the creation of the visual variable. This includes information related to UI inputs from sliders and selected themes.