UniqueValueRenderer allows you to symbolize features in a Layer based on one or more matching string attributes. This is typically done by using unique colors, fill styles, or images to represent features with equal values in a string field.
Supported layers
UniqueValueRenderer may only be used to create visualizations for the following layer types:
When constructing the renderer, the string field from which to define the unique types must be specified. Each type and its associated symbol must also be defined using the addUniqueValueInfo() method or the uniqueValueInfos property in the constructor.
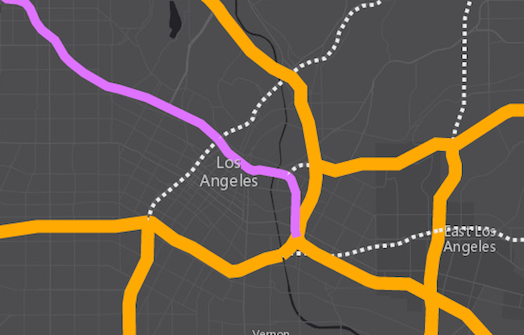
In the image below, each polyline is symbolized with a color and style that is different depending on the road classification of each feature in a layer representing major highways. For example, thick orange features represent interstate highways (freeways), purple lines represent U.S. Highways, and the thin dotted lines represent other major roads.
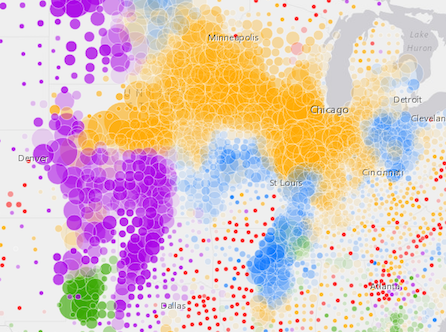
UniqueValueRenderer can also be used to thematically visualize numeric data attributes in conjunction with unique values. This is accomplished with visual variables. Visual variables define the parameters for data-driven visualizations of numeric data. They allow you to easily map continuous ramps of color, size, and/or opacity to minimum and maximum data values from one of the layer's numeric attribute fields.
When used in a UniqueValueRenderer, the unique symbol types are typically defined with color while size and/or opacity visual variables are added to create a bivariate map.
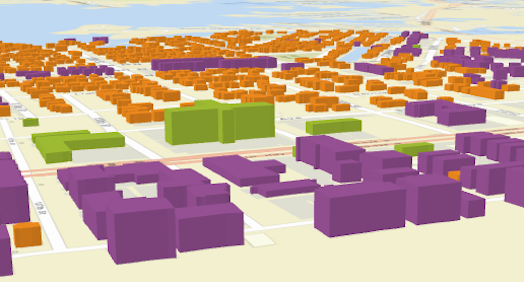
The example below uses a UniqueValueRenderer to shade each building feature with a color depending on its type (e.g. purple represents condominium, green represents hotels, orange is residential, etc.). A size visual variable is then added to depict the real-world height of each building.
To read more about visual variables see the visualVariables property.
var renderer = new UniqueValueRenderer({
  field: "REGION",
  defaultSymbol: new SimpleFillSymbol()
});
// All features with value of "North" will be blue
renderer.addUniqueValueInfo("North",
  new SimpleFillSymbol({
    color: "blue"
  })
);
// All features with value of "East" will be green
renderer.addUniqueValueInfo("East",
  new SimpleFillSymbol({
    color: "green"
  })
);
// All features with value of "South" will be red
renderer.addUniqueValueInfo({
  value: "South",
  symbol: new SimpleFillSymbol({
    color: "red"
  })
});

// All features with value of "West" will be yellow
renderer.addUniqueValueInfo({
  value: "West",
  symbol: new SimpleFillSymbol({
    color: "yellow"
  })
});

renderer.visualVariables = [{
  type: "opacityInfo",
  field: "POPULATION",
  normalizationField: "SQ_KM",
  // features with 30 ppl/sq km or below are assiged the first opacity value
  stops: [{ value: 100, opacity: 0.15 },
        { value: 1000, opacity: 0.90 }]
}];

var layer = new FeatureLayer({
  url: "http://url.to.service",
  renderer: renderer
});
Constructors
new UniqueValueRenderer(properties)
properties Object See the properties for a list of all the properties that may be passed into the constructor. |
// Typical usage
var renderer = new UniqueValueRenderer({
  field: "fieldName",
  uniqueValueInfos: [ ... ]
});
Property Overview
| Name | Type | Summary | |
|---|---|---|---|
| AuthoringInfo | Authoring metadata only included in renderers generated from one of the Smart Mapping creator methods, such as sizeRendererCreator.createContinuousRenderer() or colorRendererCreator.createContinuousRenderer(). more details | more details | |
| String | The name of the class. more details | more details | |
| String | Label used in the Legend to describe features assigned the default symbol. more details | more details | |
| Symbol | The default symbol used to draw a feature whose value is not matched or specified by the renderer. more details | more details | |
| String | Function | The name of the attribute field the renderer uses to match unique values or types. more details | more details | |
| String | If needed, specifies the name of an additional attribute field the renderer will use to match values. more details | more details | |
| String | If needed, specify the name of a third attribute field the renderer will use to match values. more details | more details | |
| String | String inserted between the values if multiple attribute fields are specified. more details | more details | |
| Object | An object providing options for displaying the renderer in the Legend. more details | more details | |
| String | The type of Renderer. more details | more details | |
| Object[] | Each element in the array is an object that provides information about a unique value associated with the renderer. more details | more details | |
| String | An Arcade expression evaluating to either a string or a number. more details | more details | |
| String | The title identifying and describing the associated Arcade expression as defined in the valueExpression property. more details | more details | |
| Object[] | Visual variables define the parameters for data-driven geographic visualizations of numeric data. more details | more details | |
Property Details
authoringInfo
Authoring metadata only included in renderers generated from one of the Smart Mapping creator methods, such as sizeRendererCreator.createContinuousRenderer() or colorRendererCreator.createContinuousRenderer(). This includes information from UI elements such as sliders and selected classification methods and themes. This allows the authoring clients to save specific overridable settings so that next time it is accessed via the UI, their selections can be remembered.
declaredClassStringreadonly
The name of the class. The declared class name is formatted as
esri.folder.className.defaultLabelString
Label used in the Legend to describe features assigned the default symbol. The default symbol is used to draw all features with unspecified, unmatched values.
defaultSymbolSymbol
The default symbol used to draw a feature whose value is not matched or specified by the renderer. If
null, unmatched features will not be assigned a symbol.Known Limitations
SceneLayers with a
meshgeometryType will display unmatching features with a generic symbol even if thedefaultSymbolisnull.The name of the attribute field the renderer uses to match unique values or types. A function may also be used to return a string value representing unique types if the desired type does not already explicitly exist in a field.
Example:// function used to return string values for types when a valid string // field for this use case (classification by population) doesn't exist function rankByPop(feature){ // a number field representing total population var population = feature.attributes.POP2010; // var used to classify features by population var rank; if(pop < 10000){ rank = "low"; } else if (pop > 10000 && pop < 50000){ rank = "medium"; } else if (pop > 50000){ rank = "high"; } return rank; } var renderer = new UniqueValueRenderer({ field: rankByPop, // values returned by this function will // be used to render features by type uniqueValueInfos: [ { value: "high", // features labeled as "High" symbol: sym1 // will be assigned sym1 }, { value: "medium", // features labeled as "Medium" symbol: sym2 // will be assigned sym2 }, { value: "low", // features labeled as "Low" symbol: sym3 // will be assigned sym2 } ] });field2String
If needed, specifies the name of an additional attribute field the renderer will use to match values. For example, if you specify two fields:
var renderer = new UniqueValueRenderer({
  field: "REGION",
  field2: "RANK",
  fieldDelimiter: ", ",  // comma + space used to separate values from all fields
  uniqueValueInfos: [
    {
      value: "North, 1",  // features in the "North" region and a rank of 1
      symbol: sym1  // will be assigned sym1
    }, {
      value: "North, 2",  // features in the "North" region and a rank of 2
      symbol: sym2  // will be assigned sym2
    },
    ...
  ]
});
All combinations of values of field and
field2are unique values and may have their own symbol.- See also:
field3String
If needed, specify the name of a third attribute field the renderer will use to match values. For example, if you specify three fields:
var renderer = new UniqueValueRenderer({
  field: "REGION",
  field2: "RANK",
  field3: "CLASS",
  fieldDelimiter: ", ",  // comma + space used to separate values from all fields
  uniqueValueInfos: [
    {
      value: "North, 1, medium",  // features in the "North" region, a rank of 1, and "medium" class
      symbol: sym1  // will be assigned sym1
    }, {
      value: "North, 2, medium",  // features in the "North" region, a rank of 2, and a "medium class
      symbol: sym2  // will be assigned sym2
    },
    ...
  ]
});
All combinations of values of field, field2, and
field3are unique values and may have their own symbol.- See also:
fieldDelimiterString
String inserted between the values if multiple attribute fields are specified.
Example:var renderer = new UniqueValueRenderer({ field: "REGION", field2: "RANK", fieldDelimiter: ", ", // comma + space used to separate values from all fields uniqueValueInfos: [ { value: "North, 1", // features in the "North" region and a rank of 1 symbol: sym1 // will be assigned sym1 }, { value: "North, 2", // features in the "North" region and a rank of 2 symbol: sym2 // will be assigned sym2 }, ... ] });legendOptionsObject
An object providing options for displaying the renderer in the Legend.
Property:optionaltitle StringDescribes the variable driving the visualization. This is displayed as the title of the corresponding renderer in the Legend and takes precedence over a field alias or valueExpressionTitle.
Example:renderer.legendOptions = { title: "Classification (high/low)" };typeStringreadonly
The type of Renderer. For UniqueValueRenderer this value is always
uniqueValue.uniqueValueInfosObject[]
Each element in the array is an object that provides information about a unique value associated with the renderer. Each object has the following specification:
valueExpressionString
An Arcade expression evaluating to either a string or a number. This expression can reference field values using the
$featureglobal variable and perform mathematical calculations and logical evaluations at runtime. Field names referenced in Arcade expressions must be included in the outFields property of the layer.This property is typically used as an alternative to field for data-driven visualizations.
Example:var renderer = new UniqueValueRenderer({ valueExpression: "When($feature.count < 20, 'low', $feature.count >= 20 && $feature.count < 70, 'moderate', $feature.count >=70, 'high', 'other')", uniqueValueInfos: [ ... ], // assigns symbols to features evaluating to 'low', 'moderate', or 'high' });valueExpressionTitleString
The title identifying and describing the associated Arcade expression as defined in the valueExpression property. This is displayed as the title of the corresponding renderer in the Legend in the absence of a provided
titlein the legendOptions property.Example:renderer.valueExpression = "IIF($feature.POP > 500000, 'high', 'low')"; renderer.valueExpressionTitle = "Classification";visualVariablesObject[]
Visual variables define the parameters for data-driven geographic visualizations of numeric data. They allow you to easily map continuous ramps of color, size, opacity, and/or rotation to minimum and maximum data values of one of the layer's numeric attribute fields.
Visual variables can primarily be used in two ways.
1. Thematic mapping
Visual variables allow you to easily create stunning visualizations based on thematic attributes (e.g. population, education, rank, money, magnitude, etc.) in either 2D or 3D. This is accomplished by mapping data values from a numeric field attribute to color, size, and/or opacity values. The renderer then takes over and re-sizes or shades features based on the value of the given field and its position relative to the minimum and maximum values. The sample below uses three visual variables (size, color, and opacity).
2. Mapping real-world sizes
The size visual variable can be used to visualize the true sizes of features (e.g. tree canopy, road width, building height, etc.) based on their size in the real world. This can be particularly powerful when working in a 3D SceneView. The image below shows a layer of building footprints that uses visual variables to extrude each feature to the true height of the buildings based on data stored in an attribute field.
The
visualVariablesproperty of the renderer is an array of objects called "visual variables". Each object must indicate the type of visual variable to apply (e.g. color, size, opacity, rotation), the numeric field from which to drive the visualization, and the ramp of visual values to map to the data. The following list identifies each visual variable type and provides a link to the specification table of each.Type Object Specification Legend Example color ColorVisualVariable 
size SizeVisualVariable 
opacity OpacityVisualVariable 
rotation RotationVisualVariable - See the Visualize features with realistic 3D symbols for an example of using multiple visual variables to visualize your data.
Method Overview
| Name | Return Type | Summary | |
|---|---|---|---|
Adds a unique value and symbol to the renderer. more details | more details | ||
| UniqueValueRenderer | Creates a deep clone of the renderer. more details | more details | |
| * | Creates a new instance of this class and initializes it with values from a JSON object generated from a product in the ArcGIS platform. more details | more details | |
| Object | Returns rendering and legend information (as defined by the renderer) associated with the given graphic. more details | more details | |
Removes a unique value from the renderer. more details | more details | ||
| Object | Converts an instance of this class to its ArcGIS Portal JSON representation. more details | more details | |
Method Details
addUniqueValueInfo(valueOrInfo, symbol)
Adds a unique value and symbol to the renderer. You can provide the value and its associated symbol as individual arguments or as an info object.
Parameters:The value to match. The value can be provided as an individual argument or as an info object described in uniqueValueInfos.
optionalsymbol SymbolThe symbol used to represent features matching the specified
value.Examples:var renderer = new UniqueValueRenderer({ field: "REGION", defaultSymbol: new SimpleFillSymbol() }); // Add a unique value info for the "North" region // using individual function arguments renderer.addUniqueValueInfo("North", new SimpleFillSymbol({ color: "blue" }) // legend will display "North" when describing // features in the North region );// Add a unique value info for the "West" region // using a unique info object renderer.addUniqueValueInfo({ value: "West", symbol: new SimpleFillSymbol({ color: "yellow" }), label: "West region" // will display this text in legend });clone(){UniqueValueRenderer}
Creates a deep clone of the renderer.
Returns:Type Description UniqueValueRenderer A deep clone of the object that invoked this method. Example:// Creates a deep clone of the first layer's renderer var renderer = view.map.layers.getItemAt(0).renderer.clone();fromJSON(json){*}static
Creates a new instance of this class and initializes it with values from a JSON object generated from a product in the ArcGIS platform. The object passed into the input
jsonparameter often comes from a response to a query operation in the REST API or a toJSON() method from another ArcGIS product. See the Using fromJSON() topic in the Guide for details and examples of when and how to use this function.Parameter:json ObjectA JSON representation of the instance in the ArcGIS format. See the ArcGIS REST API documentation for examples of the structure of various input JSON objects.
Returns:Type Description * Returns a new instance of this class. getUniqueValueInfo(graphic){Object}
Returns rendering and legend information (as defined by the renderer) associated with the given graphic.
Parameter:graphic GraphicThe graphic whose rendering and legend information will be returned.
Returns:Type Description Object An object describing the rendering and legend information of the input graphic. removeUniqueValueInfo(value)
Removes a unique value from the renderer.
Parameter:value StringValue to remove from uniqueValueInfos.
Example:// removes the unique value info object for // features in the West region. They will now // be displayed with the default symbol and label renderer.removeUniqueValueInfo("West");Converts an instance of this class to its ArcGIS Portal JSON representation. See the Using fromJSON() topic in the Guide for more information.
Returns:Type Description Object The ArcGIS Portal JSON representation of an instance of this class.