Method Overview
| Name | Return Type | Summary | |
|---|---|---|---|
| ColorScheme | Clones a color scheme object. more details | more details | |
| ColorScheme | Flips the colors in reverse order of the input color scheme. more details | more details | |
| Object | Returns a primary scheme and secondary schemes defining symbol properties for data-driven color visualizions in a FeatureLayer. more details | more details | |
| Object[] | Returns metadata for the available themes. more details | more details | |
Method Details
cloneScheme(scheme){ColorScheme}
Clones a color scheme object.
Parameter:scheme ColorSchemeThe color scheme object to clone.
Returns:Type Description ColorScheme Returns a clone of the given color scheme object. Example:// clones the primary scheme returned from the getSchemes() method var colorScheme = primaryScheme.clone();flipColors(scheme){ColorScheme}
Flips the colors in reverse order of the input color scheme.
Parameter:scheme ColorSchemeThe color scheme to reverse.
Returns:Type Description ColorScheme Returns the input color scheme with its colors in reverse order. Example:// reverses the order of colors in a primary scheme // obtained from the getSchemes() method var flippedScheme = colorSchemes.flipColors(primaryScheme);getSchemes(params){Object}
Returns a primary scheme and secondary schemes defining symbol properties for data-driven color visualizions in a FeatureLayer. The
basemapparameter determines the color schemes of the graphics used to visualize each feature. ThegeometryTypedetermines which type of symbol to return.Parameters:params ObjectSee the table below for details of each parameter that may be passed to this function.
Specification:The basemap to pair with the visualization. This value indicates the best symbol colors for visualizing features against the given basemap.
geometryType StringThe geometry type of the features to visualize.
Known Values: point | multipoint | polyline | polygon | meshtheme StringThe theme determines which values will be emphasized in the continuous ramp and the map. Valid values are listed below.
Value Description Example high-to-low High values are emphasized with strong colors. 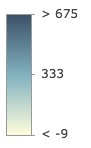
above-and-below Values centered around a given point (e.g. the average) are visualized with weak colors while other values are emphasized with strong colors. 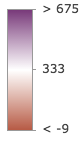
centered-on Values centered around a given point (e.g. the average) are emphasized with strong colors while other values are visualized with weak colors. 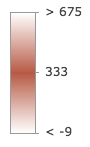
extremes High and low values are emphasized with strong colors. All others are visualized with weak colors. 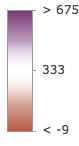 optionalview SceneView
The SceneView instance in which the scheme will be used. This property is only applicable when the scheme will be used in conjunction with 3D symbols.
optionalworldScale BooleanIndicates if the size units of the scheme will be in meters. This should be
truewhen the scheme is intended for 3D volumetric symbology. Aviewmust be provided if this property is set totrue.Returns:Type Description Object Returns an object containing the optimal color scheme to use for the given basemap and secondary schemes that may also be used. See the table below for more details of this object. Property Type Description primaryScheme ColorScheme The color scheme best suited for the given basemap, geometry type, and theme. secondarySchemes ColorScheme[] Additional color schemes that may be used to visualize data of the given geometry type overlaid on the given basemap. Example:// gets the primary scheme for the features of the given geometry type and basemap var schemes = colorSchemes.getSchemes({ basemap: map.basemap, geometryType: featureLayer.geometryType, theme: "extremes" }); // the best default scheme for the layer, basemap, and theme var primaryScheme = schemes.primaryScheme;getThemes(basemap){Object[]}
Returns metadata for the available themes. If a
basemapis provided, returns themes that look best with the given basemap.Parameter:optional The Esri basemap string or object that will be used with the returned theme(s).
Returns:Type Description Object[] Returns an array of objects that describe various themes that pair well with the given basemap. See the table below for more details of the properties in this object. Property Type Description name String The name of the theme. label String The label identifying the theme in UI elements. description String Text describing the theme in the UI. basemaps String[] The Esri basemaps that pair well with the given theme.
Type Definitions
ColorScheme
Properties defining the symbology scheme used to visualize features with attribute data-driven color.
Properties:id StringThe unique id of the color scheme to usee in the visualization. The id is assigned based on the following template:
<themeName>/<basemapName>/<schemeName>.theme StringIndicates which values will be emphasized in the continuous ramp and the map. Valid values are listed below.
Value Description Example high-to-low High values are emphasized with strong colors. above-and-below Values centered around a given point (e.g. the average) are visualized with weak colors while other values are emphasized with strong colors. centered-on Values centered around a given point (e.g. the average) are emphasized with strong colors while other values are visualized with weak colors. extremes High and low values are emphasized with strong colors. All others are visualized with weak colors. colors Color[]The continuous color ramp that will be applied to the visualization.
noDataColor ColorThe color of the symbol used to indicate features with no data and features that are out of range.
colorsForClassBreaks Object[]Predefined classed color schemes to use for the visualization.
Specification:colors Color[]An array of hex color strings. Each color is assigned to a specific break in classed color visualizations.
numClasses NumberThe number of classes used in the classed color visualization.
outline ObjectProperties for defining the outline of the symbol.
Specification:color ColorThe outline color of the symbol.
width NumberThe width of the symbol in pixels or points.
size NumberThe default size of the symbol in pixels or points if the geometry type is
point.width NumberThe default width of the symbol in pixels or points if the geometry type is
polyline.opacity NumberThe opacity of the symbol.